智能大数据可视化实验室
Intelligent Big Data Visualization Lab (iDVx)
visual narrative
Powering the future with data narratives
visual narrative
Powering the future with data narratives
SUMMARY
This project page demonstrates works under two categories:
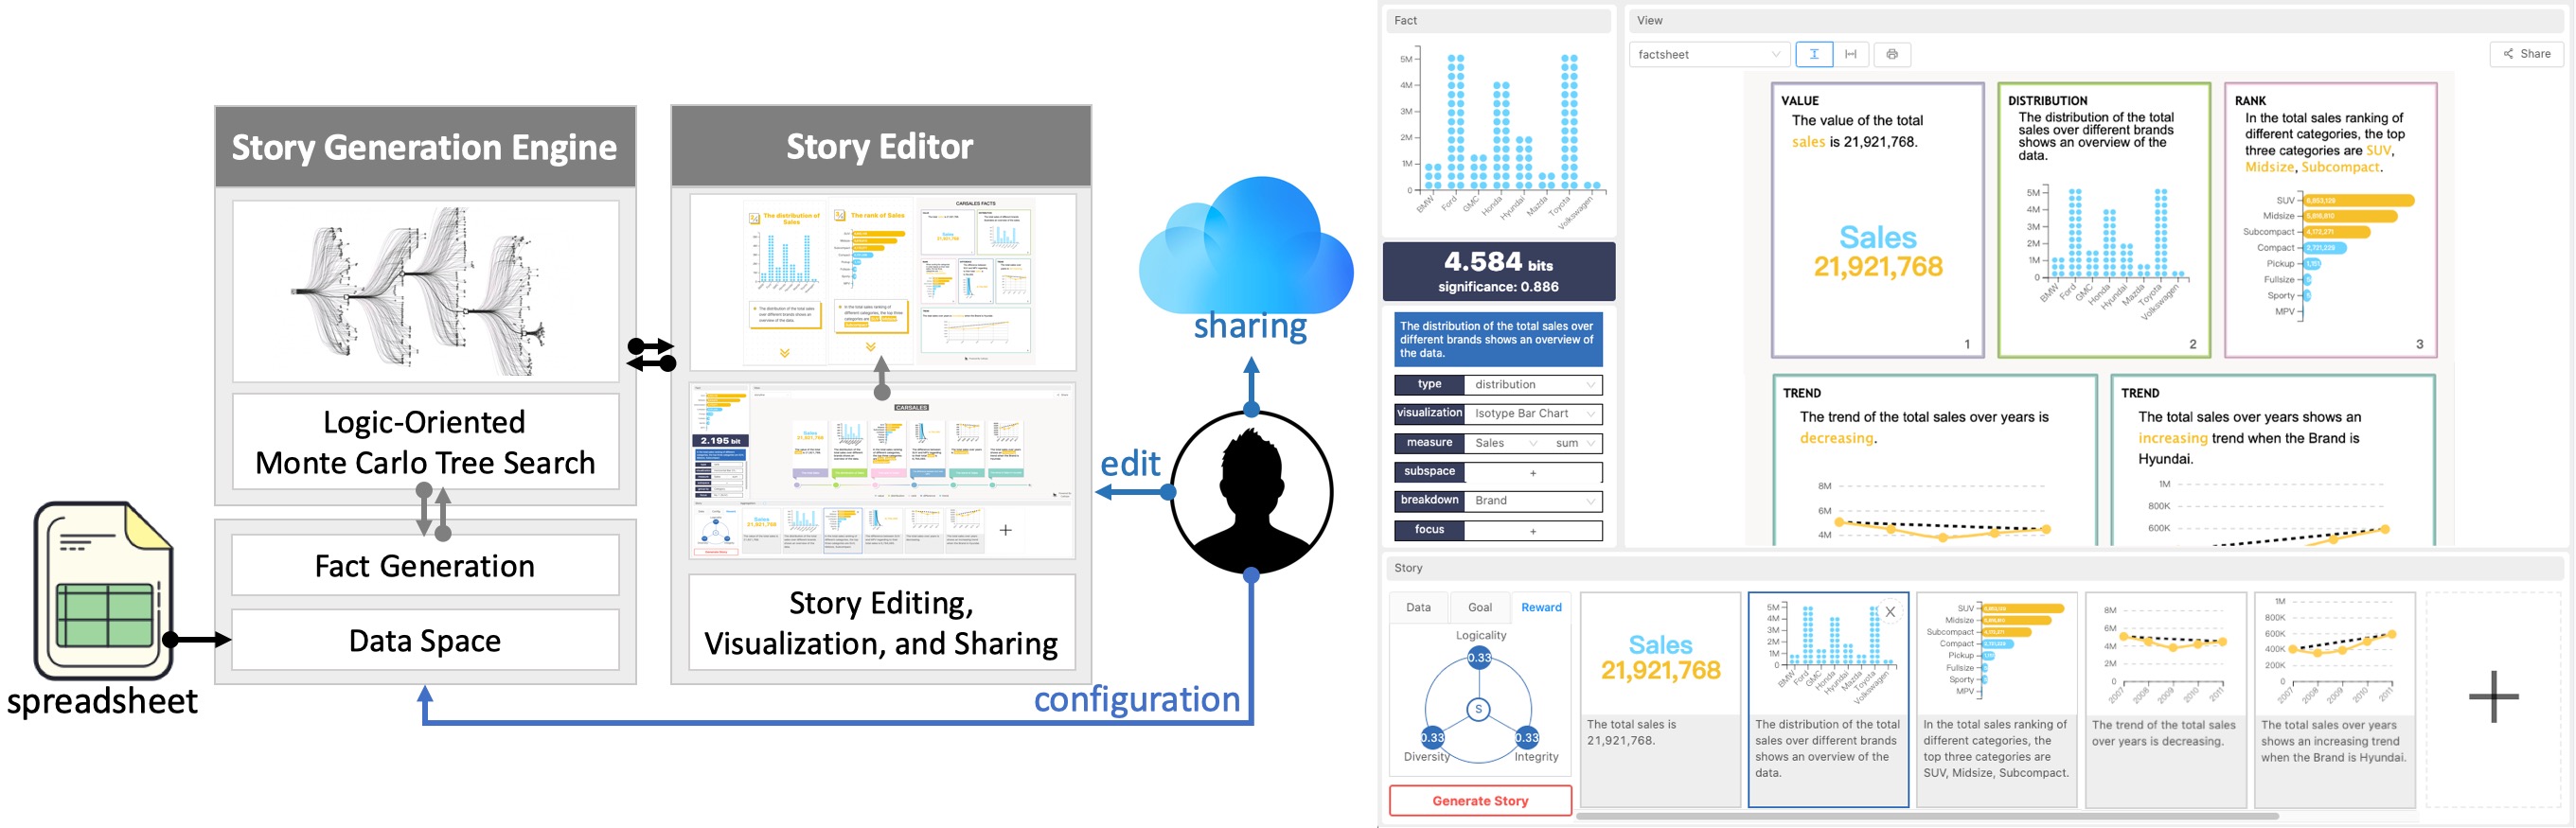
• Calliope: an intelligent system for automatically generating, editing, and sharing visual data stories.
• Researches that are broadly related to narrative visualization, including infographics, factsheet, animation, data video, annotated chart, and so on.
Keywords: Data-driven Storytelling, Automatic Visual Design, Information Visualization
APPLICATIONS


UPDATES
-
Sep 2022
Our paper entitled "Erato: Cooperative Data Story Editing via Fact Interpolation" was accepted for publication in IEEE TVCG.
-
Sep 2022
Our paper entitled "Breaking the Fourth Wall of Data Stories through Interaction" was accepted for publication in IEEE TVCG.
-
Sep 2022
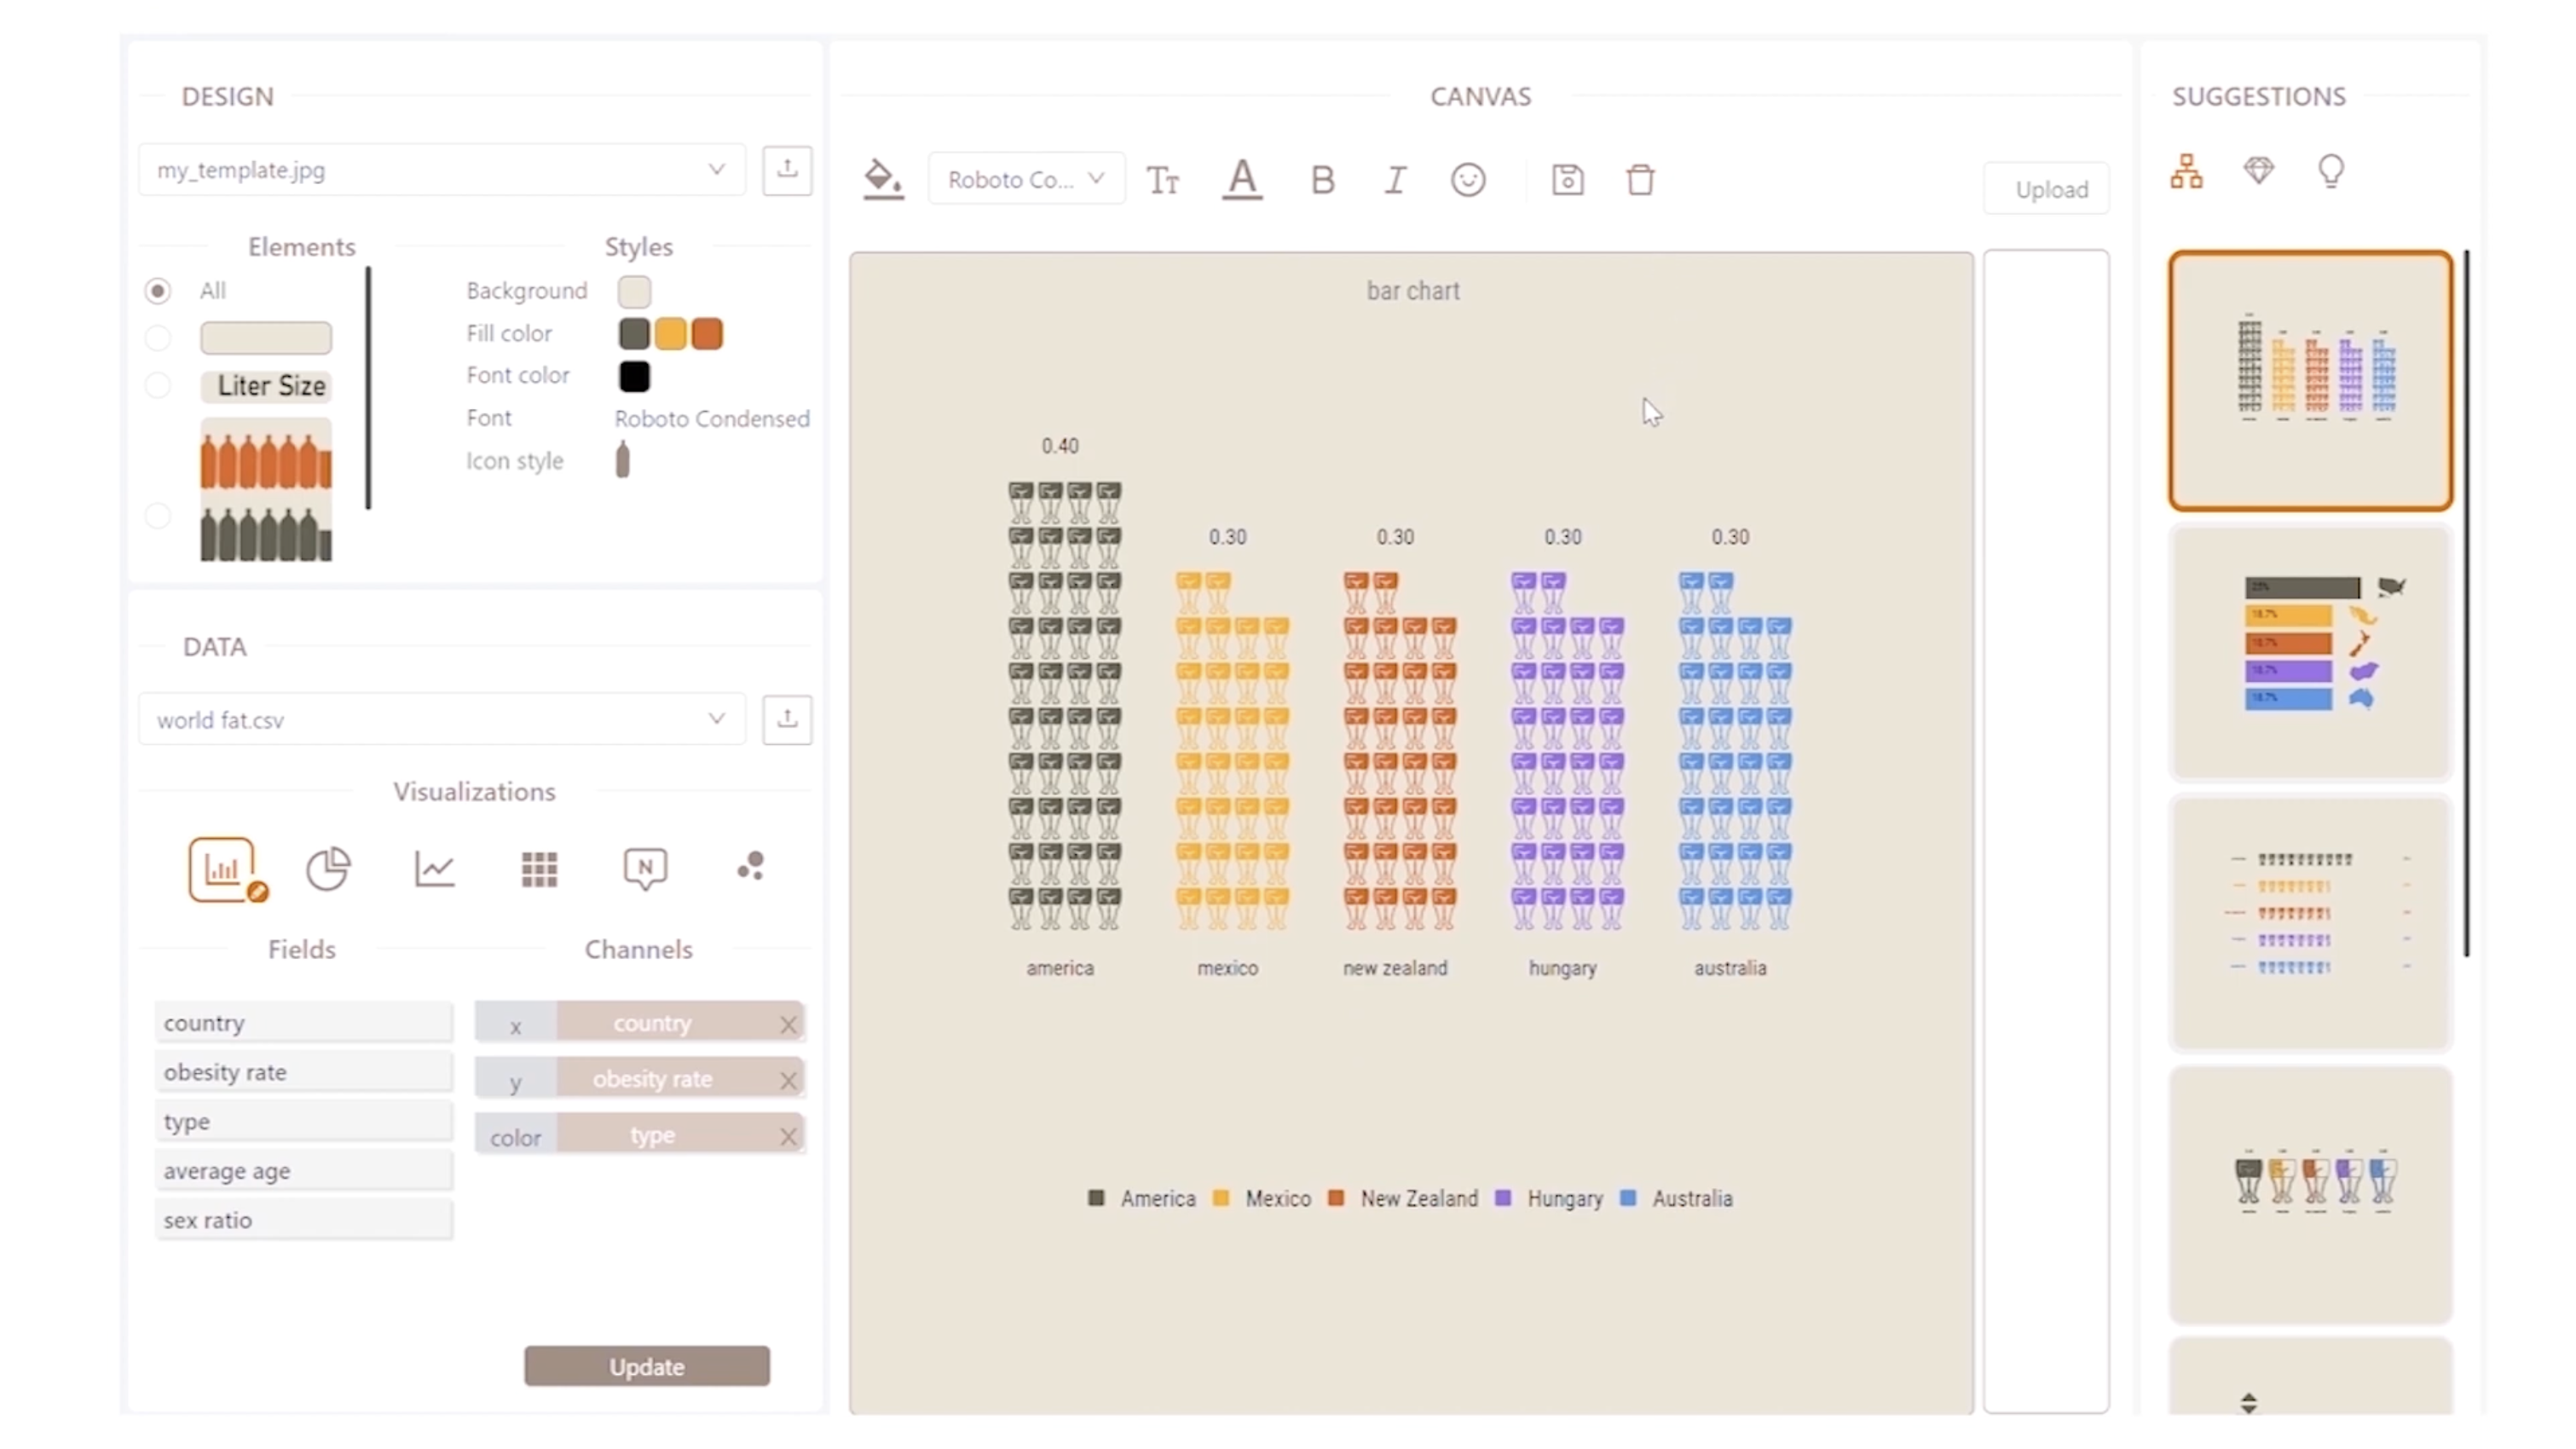
Our paper entitled "Supporting Expressive and Faithful Pictorial Visualization Design with Visual Style Transfer" was accepted for publication in IEEE TVCG.
-
Sep 2022
Our paper entitled "Diverse Interaction Recommendation for Public Users Exploring Multi-view Visualization using Deep Learning" was accepted for publication in IEEE TVCG.
-
Sep 2022
Our paper entitled "ColorCook: Augmenting Color Design for Dashboarding with Domain-Associated Palettes" was accepted for publication in CSCW2022.
-
Apr 2022
Our paper entitled "Negative Emotions, Positive Outcomes? Exploring the Communication of Negativity in Serious Data Stories" was accepted for publication in SIGCHI2022.
-
Sep 2021
Our paper entitled "VizLinter: A Linter and Fixer Framework for Data Visualization" was accepted for publication in IEEE TVCG.
-
Sep 2021
Our paper entitled "A Design Space for Applying the Freytag’s Pyramid Structure to Data Stories" was accepted for publication in IEEE TVCG.
-
Sep 2021
Our paper entitled "Kineticharts: Augmenting Affective Expressiveness of Charts in Data Stories with Animation Design" was accepted for publication in IEEE TVCG.
-
Jun 2021
Our paper entitled "AutoClips: An Automatic Approach to Video Generation from Data Facts" was accepted for publication in EuroVis 2021.
-
Feb 2021
Our paper entitled "Understanding the Design Space for Animated Narratives Applied to Illustrations" was accepted to the CHI 2021 Late-Breaking Work.
VIDEOS
Task-Oriented Optimal Sequencing of Visualization Charts
Calliope: Automatic Visual Data Story Generation from a Spreadsheet (Presentation)
Calliope: Automatic Visual Data Story Generation from a Spreadsheet (Video)
Communicating with Motion: A Design Space for Animated Visual Narratives in Data Videos (Presentation)
Communicating with Motion: A Design Space for Animated Visual Narratives in Data Videos (Video)
Understanding Narrative Linearity for Telling ExpressiveTime-Oriented Stories (Video)
Understanding Narrative Linearity for Telling ExpressiveTime-Oriented Stories (Presentation)
Smile or Scowl? Looking at Infographic Design Through the Affective Lens (Presentation)
AutoClips: An Automatic Approach to Video Generation from Data Facts (Video)

AutoClips: An Automatic Approach to Video Generation from Data Facts (Presentation)
Kineticharts: Augmenting Affective Expressiveness of Charts in Data Stories with Animation Design (Video)
Kineticharts: Augmenting Affective Expressiveness of Charts in Data Stories with Animation Design (Presentation)
A Design Space for Applying the Freytag’s Pyramid Structure to Data Stories (Video)
A Design Space for Applying the Freytag’s Pyramid Structure to Data Stories (Presentation)
VizLinter: A Linter and Fixer Framework for Data Visualization (Video)
VizLinter: A Linter and Fixer Framework for Data Visualization (Presentation)
Negative Emotions, Positive Outcomes? Exploring the Communication of Negativity in Serious Data Stories (Video)
Negative Emotions, Positive Outcomes? Exploring the Communication of Negativity in Serious Data Stories (Presentation)
Erato: Cooperative Data Story Editing via Fact Interpolation (Video)
Erato: Cooperative Data Story Editing via Fact Interpolation (Presentation)
Breaking the Fourth Wall of Data Stories through Interaction (Presentation)
Supporting Expressive and Faithful Pictorial Visualization Design with Visual Style Transfer (Video)
Supporting Expressive and Faithful Pictorial Visualization Design with Visual Style Transfer (Presentation)
ColorCook: Augmenting Color Design for Dashboarding with Domain-Associated Palettes (Video)
ColorCook: Augmenting Color Design for Dashboarding with Domain-Associated Palettes (Presentation)
PUBLICATIONS
Mengdi Sun, Ligan Cai, Weiwei Cui, Yanqiu Wu, Yang Shi, Nan Cao
Erato: Cooperative Data Story Editing via Fact Interpolation
IEEE Transactions on Visualization and Computer Graphics (IEEE Vis2022)
paper |
video |
presentation |
demo |
website
Yang Shi, Tian Gao, Xiaohan Jiao, Nan Cao
Breaking the Fourth Wall of Data Stories through Interaction
IEEE Transactions on Visualization and Computer Graphics (IEEE Vis2022) (Honorable Mention)
paper |
presentation |
explorer
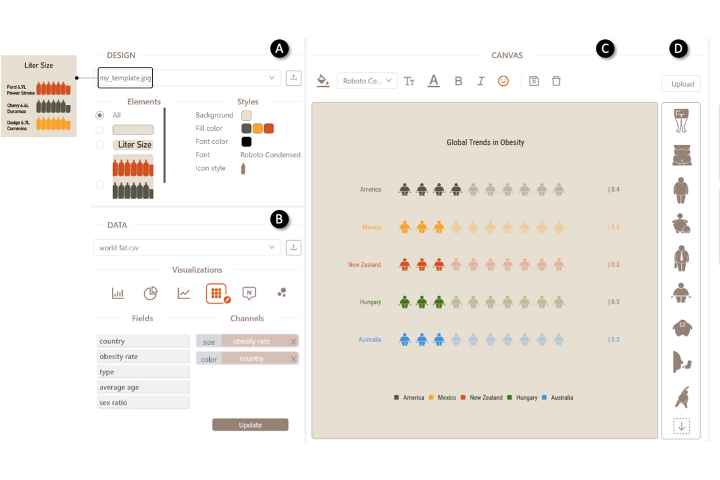
Yang Shi, Pei Liu, Siji Chen, Mengdi Sun, Nan Cao
Supporting Expressive and Faithful Pictorial Visualization Design with Visual Style Transfer
IEEE Transactions on Visualization and Computer Graphics (IEEE Vis2022) (Honorable Mention)
paper |
video |
presentation |
explorer
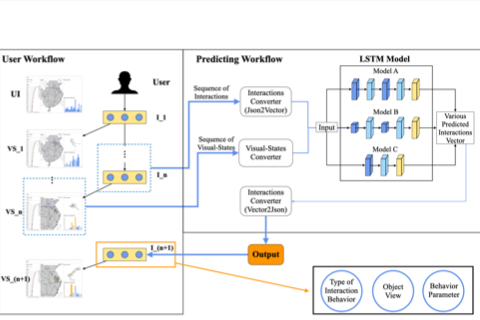
Yixuan Li, Yusheng Qi, Yang Shi, Qing Chen, Nan Cao, Siming Chen
Diverse Interaction Recommendation for Public Users Exploring Multi-view Visualization using Deep Learning
IEEE Transactions on Visualization and Computer Graphics (IEEE Vis2022)
paper
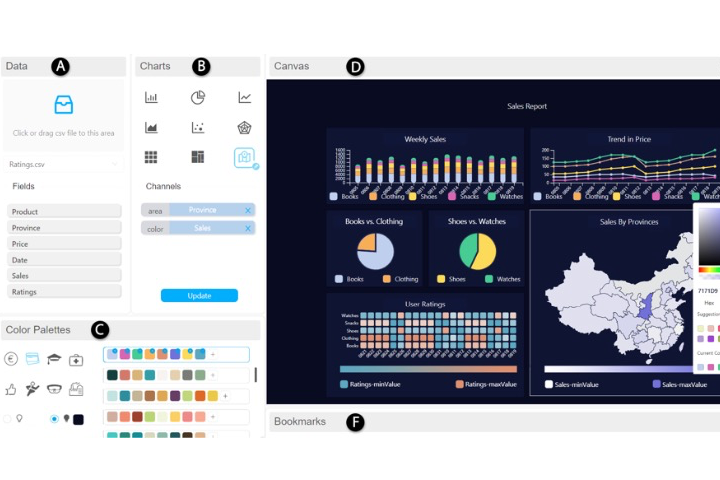
Yang Shi, Siji Chen, Pei Liu, Jiang Long, Nan Cao
ColorCook: Augmenting Color Design for Dashboarding with Domain-Associated Palettes
In Proceedings of the ACM on Human-Computer Interaction (CSCW2022)
paper |
video |
presentation |
explorer
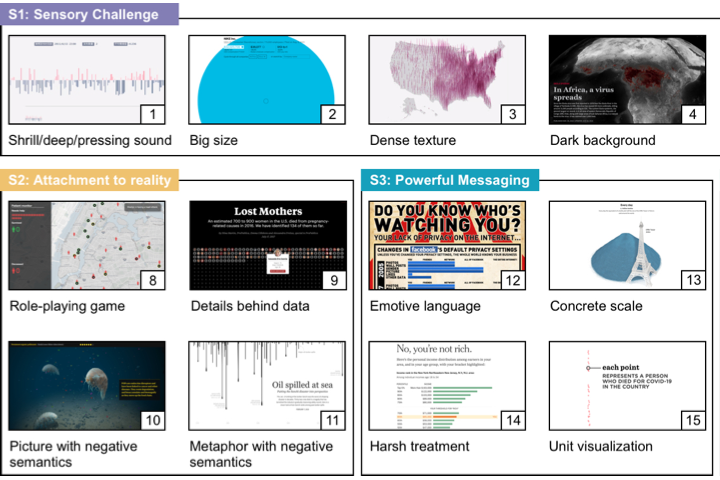
Xingyu Lan, Yanqiu Wu, Yang Shi, Qing Chen, Nan Cao
Negative Emotions, Positive Outcomes? Exploring the Communication of Negativity in Serious Data Stories
In Proceedings of the ACM CHI Conference on Human Factors in Computing Systems (SIGCHI2022)
paper | video | presentation | explorer
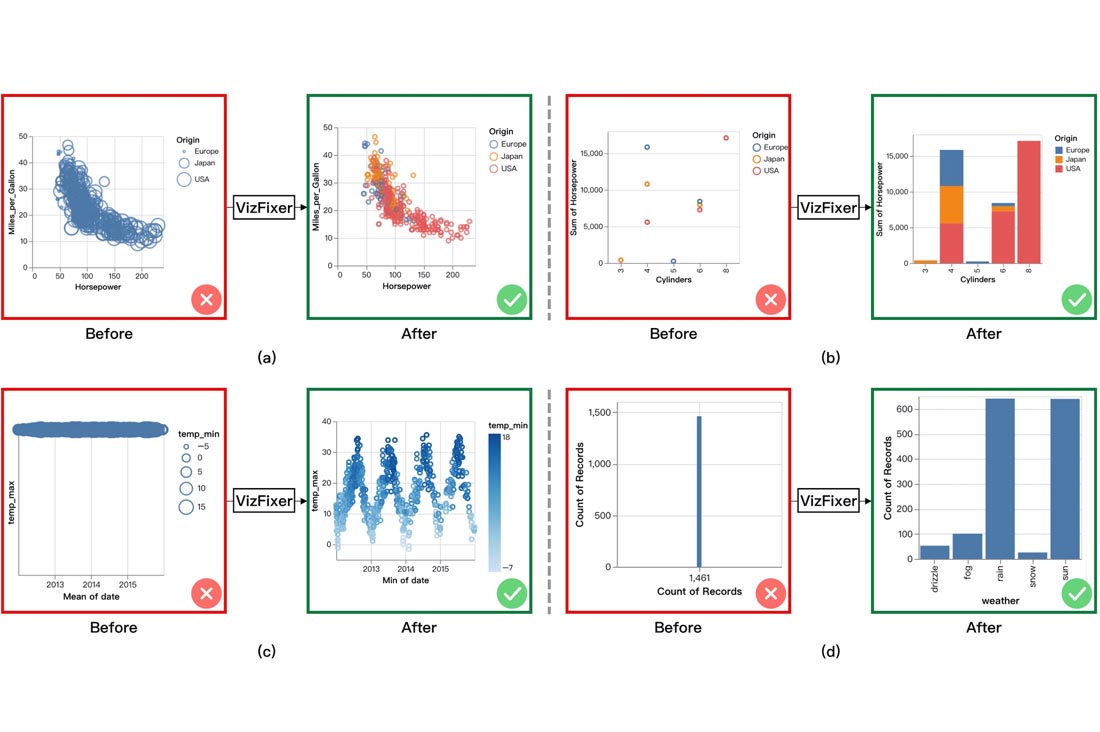
Qing Chen, Fuling Sun, Xinyue Xu, Zui Chen, Jiazhe Wang, Nan Cao
VizLinter: A Linter and Fixer Framework for Data Visualization
IEEE Transactions on Visualization and Computer Graphics (IEEE Vis2021)
paper | video | presentation | demo | website
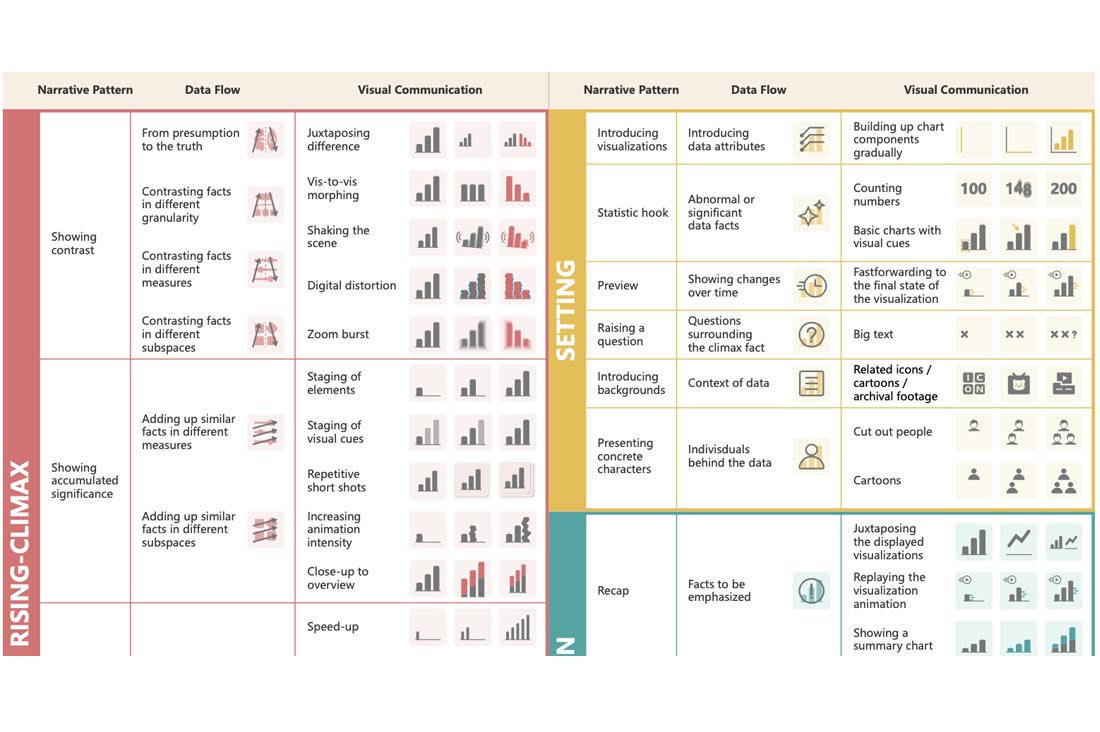
Leni Yang, Xian Xu, Xingyu Lan, Ziyan Liu, Shunan Guo, Yang Shi, Huamin Qu, Nan Cao
A Design Space for Applying the Freytag’s Pyramid Structure to Data Stories
IEEE Transactions on Visualization and Computer Graphics (IEEE Vis2021)
paper | video | presentation | explorer
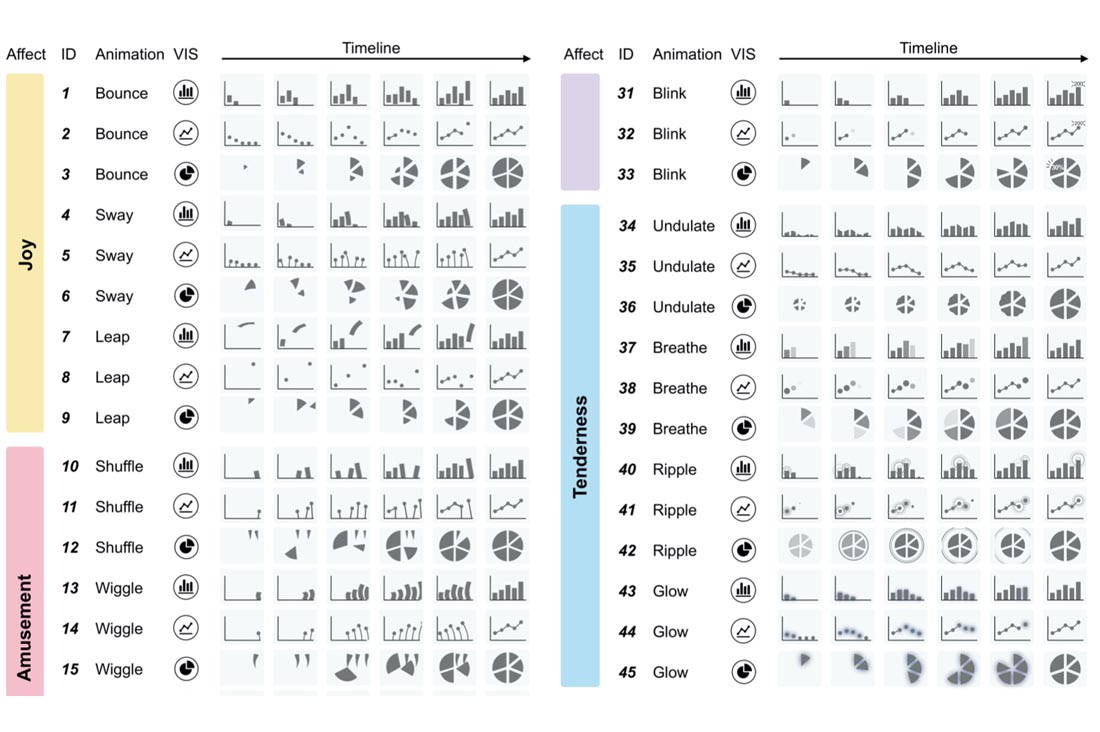
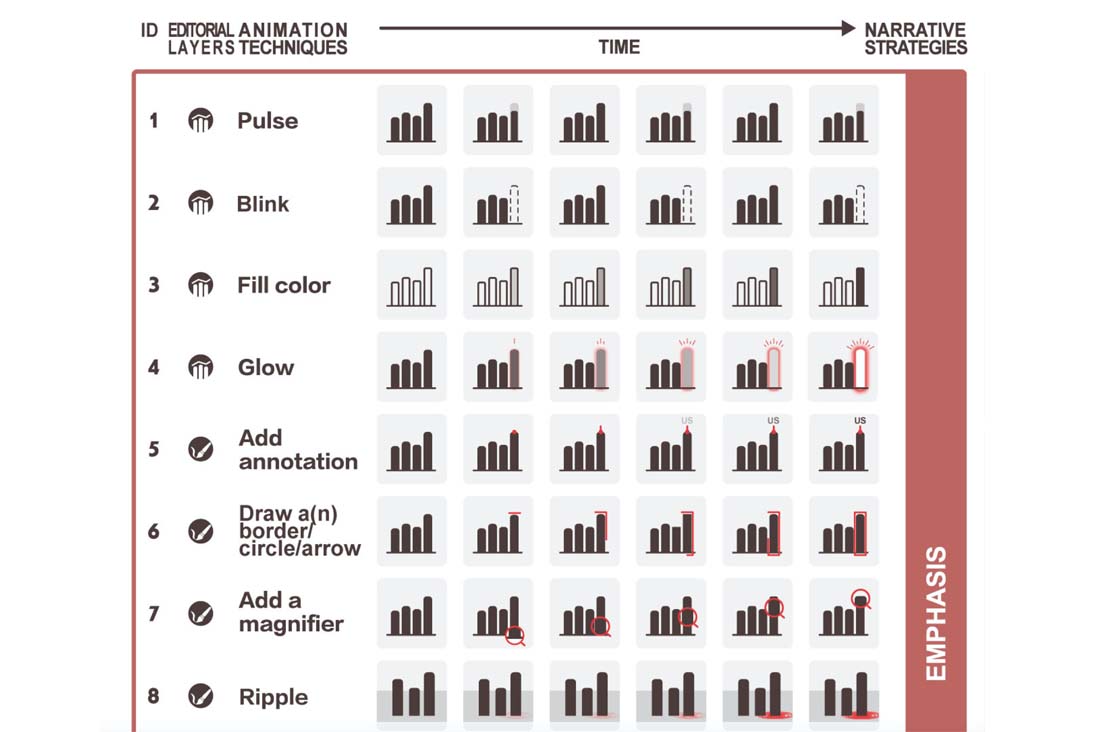
Xingyu Lan, Yang Shi, Yanqiu Wu, Xiaohan Jiao, Nan Cao
Kineticharts: Augmenting Affective Expressiveness of Charts in Data Stories with Animation Design
IEEE Transactions on Visualization and Computer Graphics (IEEE Vis2021)
paper | video | presentation | explorer
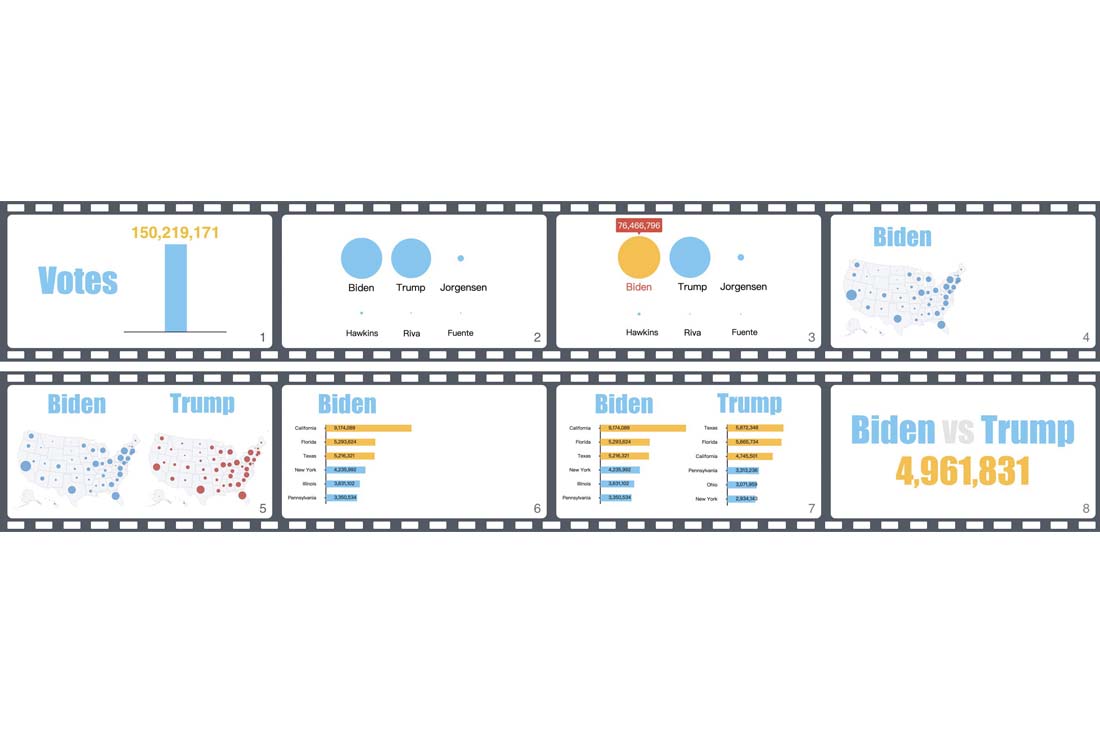
Danqing Shi, Fuling Sun, Xinyue Xu, Xingyu Lan, David Gotz, Nan Cao
AutoClips: An Automatic Approach to Video Generation from Data Facts
Computer Graphics Forum (EuroVis 2021)
paper | video | presentation | demo
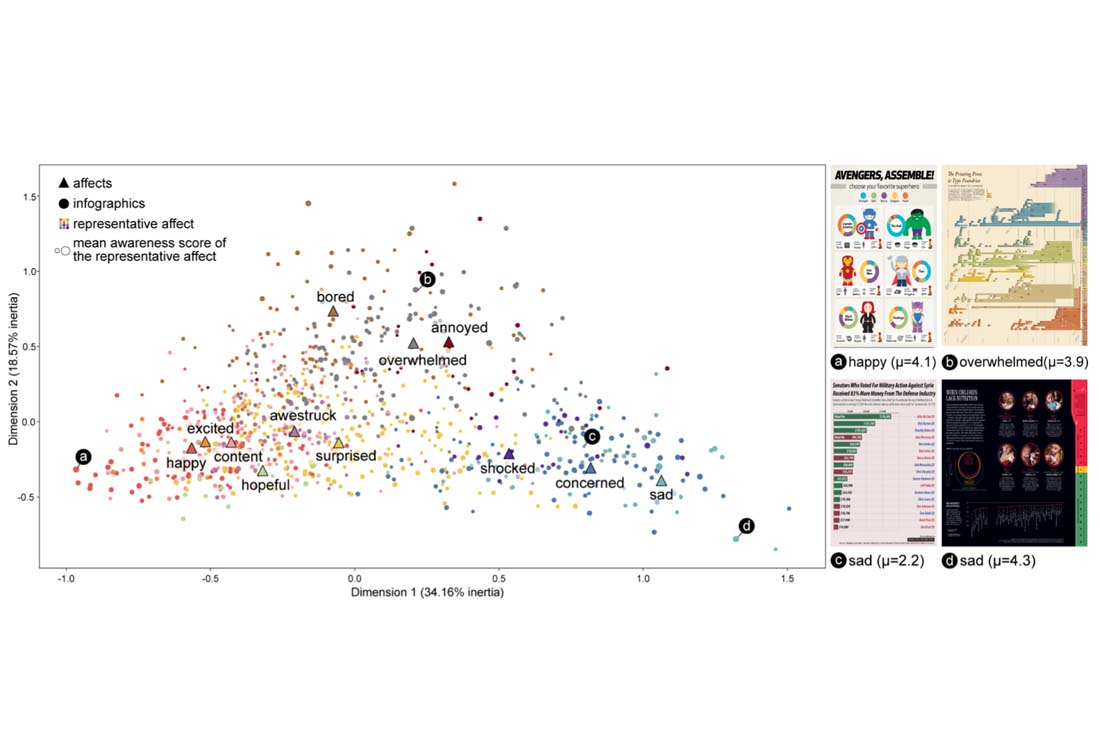
Xingyu Lan, Yang Shi, Yueyao Zhang, Nan Cao
Smile or Scowl? Looking at Infographic Design Through the Affective Lens
IEEE Transactions on Visualization and Computer Graphics (IEEE PacificVis 2021)
paper | presentation | explorer
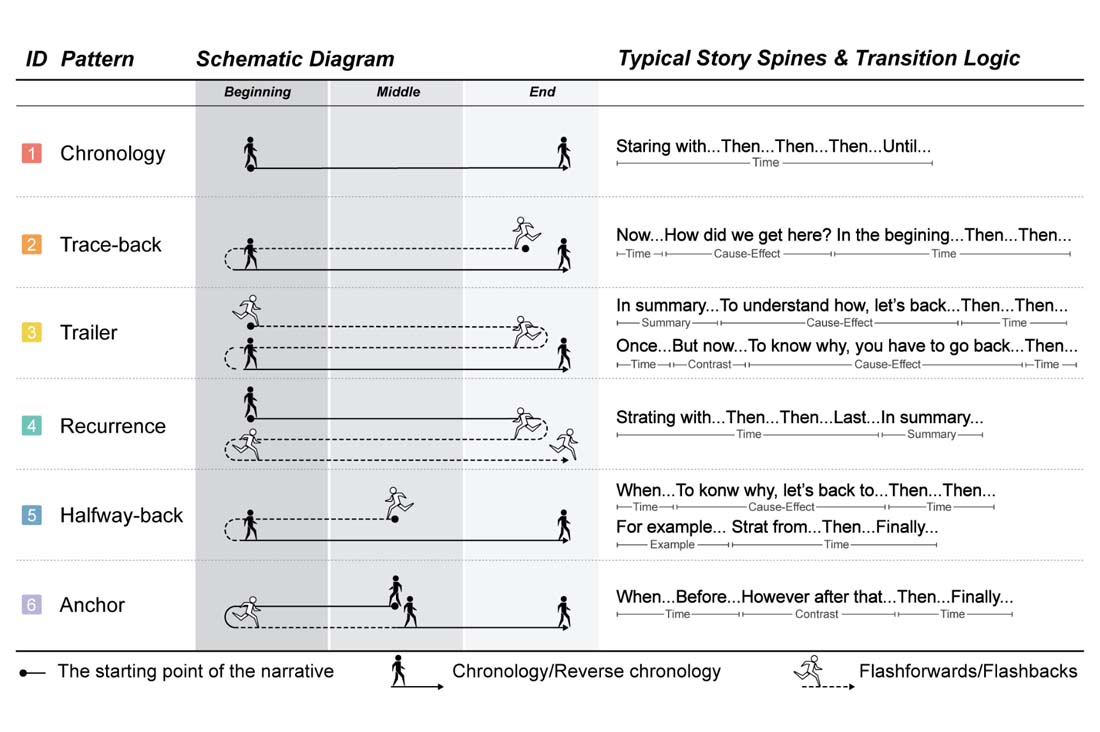
Xingyu Lan, Xinyue Xu, Nan Cao
Understanding Narrative Linearity for Telling ExpressiveTime-Oriented Stories
In Proceedings of the ACM CHI Conference on Human Factors in Computing Systems (SIGCHI2021)
paper | video | presentation
Yang Shi, Xingyu Lan, Jingwen Li, Zhaorui Li, Nan Cao
Communicating with Motion: A Design Space for Animated Visual Narratives in Data Videos
In Proceedings of the ACM CHI Conference on Human Factors in Computing Systems (SIGCHI2021)
paper | video | presentation | explorer
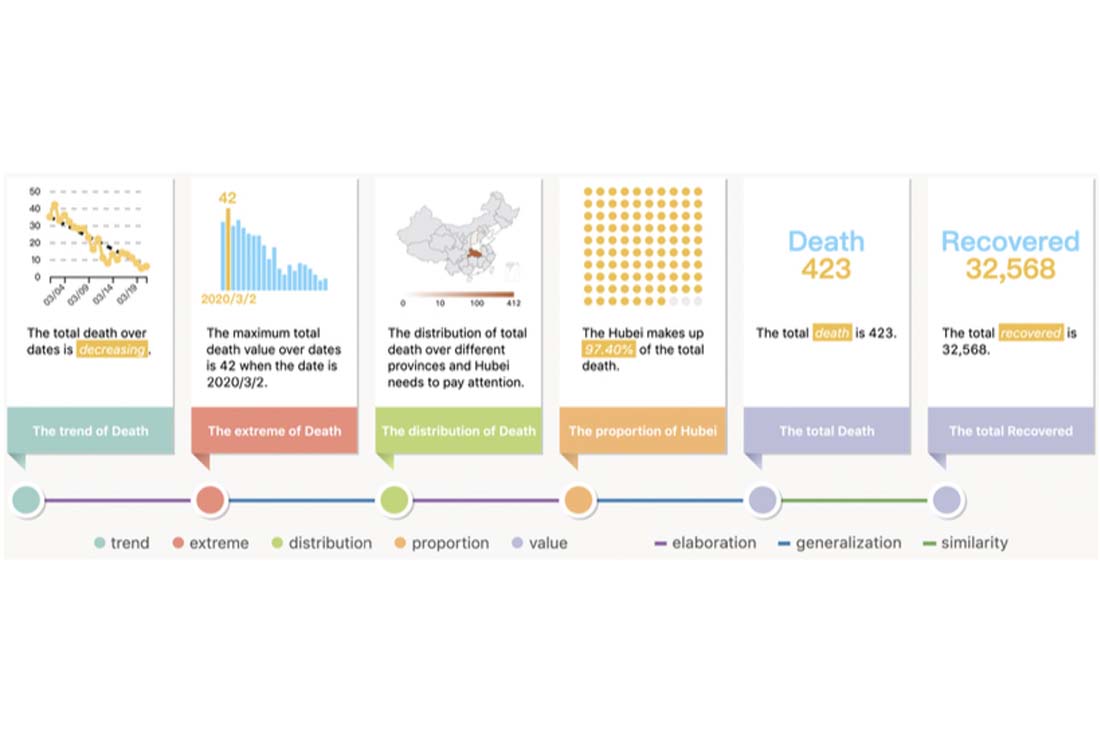
Danqing Shi, Xinyue Xu, Fuling Sun, Yang Shi, Nan Cao
Calliope: Automatic Visual Data Story Generation from a Spreadsheet
IEEE Transactions on Visualization and Computer Graphics (IEEE InfoVis2020)
paper | video | presentation | demo
Danqing Shi, Yang Shi, Xinyue Xu, Nan Chen, Siwei Fu, Hongjin Wu, Nan Cao
Task-Oriented Optimal Sequencing of Visualization Charts
IEEE Visualization in Data Science (VDS2019)
paper | presentation
PARTICIPANTS

Shunan Guo (郭姝男)
PhD Student
Period of Participation:
2016-2020

Danqing Shi (史丹青)
PhD Student
Period of Participation:
2018-2021

Xingyu Lan (蓝星宇)
PhD Student
Period of Participation:
2020-2021

Yi Guo (郭熠)
PhD Student
Period of Participation:
2020-2021

Zui Chen (陈最)
PhD Student
Period of Participation:
2020-2021

Yanqiu Wu (吴妍秋)
Designer
Period of Participation:
2019-2021

Nan Chen (陈楠)
Master Student
Period of Participation:
2018-2021

Xinyue Xu (许欣悦)
Master Student
Period of Participation:
2019-2021

Fuling Sun (孙馥玲)
Master Student
Period of Participation:
2019-2021

Ziyan Liu (刘恣嫣)
Master Student
Period of Participation:
2020-2021

Xiaohan Jiao (焦晓涵)
Master Student
Period of Participation:
2020-2021

Mengdi Sun (孙梦迪)
Master Student
Period of Participation:
2021-2022

Ligan Cai (彩丽甘)
Master Student
Period of Participation:
2021-2022

Tian Gao (高天)
Master Student
Period of Participation:
2021-2022

Pei Liu (刘佩)
Master Student
Period of Participation:
2021-2022

Siji Chen (陈思极)
Master Student
Period of Participation:
2021-2022